
Property Tax Fairness
From the Center for Municipal Finance
Updates: An Evaluation of the Residential Property Tax Equity in New York City
In addition to our national review of property assessments, the Center has provided more detailed analysis for a number of America’s largest metropolitan regions. The findings of these local reports have been used to support a number of local government reforms and media investigations, providing real-world impact for our academic work.
These reports focus on a single community and were conducted using data sourced directly from local governments, rather than our commercial providers. Because our local reports used different data sets than our national review, the underlying numbers may not be an exact match; but importantly, the findings are the same.
- Boston
- Chicago and Cook County
- Columbus and Franklin County
- Detroit
- Indianapolis and Marion County
- Las Vegas and Clark County
- Los Angeles and Los Angeles County
- Miami and Miami-Dade County
- Minneapolis and Hennepin County
- New York City
- Philadelphia Combined City-County
- Seattle and King County
- St. Louis County
Download Professor Berry’s nationwide study of property tax regressivity here.
Below are a number of papers written by CMF-affiliated researchers, addressing a range of related topics.
- Cook County Scavenger Sale Study: March 24th, 2021 – This report presents an analysis of the Cook County Scavenger Auction, the system through which tax delinquent properties are sold to private or public bidders.
- National Profile of Assessment Regressivity: 2020 – This report contains basic analysis of assessment regressivity at a nationwide level, as well as for individual states and counties.
- Taxed Out: Illegal property tax assessments and the epidemic of tax foreclosures in Detroit, Bernadette Atuahene & Christopher Berry, 2018 – This Article evaluated the impact of unconstitutional tax assessments on property tax foreclosures. Controlling for purchase price, location, and time-of-sale, the authors show that residential properties with higher assessment ratios sold in Detroit since 2009 were more likely to experience a subsequent tax foreclosure. The paper estimates that 10 percent of all these tax foreclosures were caused by illegally inflated tax assessments.
- Estimating Property Tax Shifting Due to Regressive Assessments An Analysis of Chicago, 2011 to 2015, Christopher Berry, 2018 – This research brief proposes a method for estimating residential property tax shifting due to regressive assessments. Estimates for Chicago suggest that $2.2 billion was shifted from undertaxed properties onto over-tax properties from 2011 to 2015, shifting roughly $800 million in property taxes was from the top 10 percent of properties onto the bottom 90 percent during this period.
- Testimony Before the Cook County Board of Commissioners, Christopher Berry, July 18, 2017 – Professor Chris Berry offers testimony regarding regressivity in the Cook County, Illinois property assessment system.
- The Impact of Property Tax Appeals on Vertical Equity in Cook County, IL, Robert Ross, 2017 – Cook County has one of the highest rates of property tax appeals in the country. Do appeals make property taxes more fair and accurate? Using administrative property tax data from Cook County, Illinois, this paper provides evidence that the tax appeals process in this jurisdiction has the effect of exacerbating an already regressive system. The author further demonstrates that effective tax rates are higher in neighborhoods with a higher percentage of minorities, and lower in wealthier and better educated neighborhoods.
- Regressivity in Cook County Property Taxes : The effect of appeals, City Lab, 2016 – This presentation summarizes the findings of the above paper.
Property taxes are, in principle, meant to be proportional to the value of the property. Regardless of the value of a property, all homes should be assessed the same proportion of their value. If a county assesses homes at 50% of their sale price, it shouldn’t matter whether that home sells for $100 or $100,000, they should both be assessed at 50%.
How is a typical property assessed?
One obstacle that all assessors face: this process assumes that a property’s value is well known; in fact, this is seldom the case. For a property that has sold recently, the sale price is usually a reasonable approximation of its market value. But only a small number of properties are sold in any given year—about 5% of all homes. For the remaining 95% of homes, the value must somehow be estimated. This is the job of local assessors:
- The local assessor’s office compiles a list of all of recently-sold properties and identifies important characteristics of each property such as square footage, the number of bedrooms, the size of the yard, the age of the property, etc.
- The assessor’s office uses a statistical model to estimate the relationship between each property’s relevant characteristics and its’ expected sale price, using data from the sample of recently sold properties. For instance, each additional square foot of building space adds X dollars to the sale price, an additional bathroom adds a certain amount of value, and so on.
- This model is used to estimate the values of all similarly situated homes that haven’t sold, based on the property’s features. That is, the assessor assumes that the relationship between property features and prices for the sold properties would have been the same for the unsold properties. For example, if, among properties that sold, the average price for a 2,000 square foot, 3-bedroom home was $100,000, the assessor assumes that other 2,000 square foot, 3-bedroom homes that weren’t sold are worth $100,000. In principle, these comparisons should be limited to homes within the same neighborhood, since the price of similar homes can vary significantly across locations, particularly in larger communities.
- The assessed value from this process becomes the basis on which property taxes are levied.
What is property tax regressivity?
Inaccurate assessments can result in property taxes that are disproportionate to a property’s actual value. If a property’s assessed value is greater than its actual value, the property owner will be over-taxed; while a property whose assessed value is less than its actual value will result in the property owner being under-taxed.
While no assessment system is perfectly accurate, one type of inaccuracy is particularly concerning: regressivity. Assessments are regressive when low-value homes are assessed at a higher percentage of their true market value than are high-value homes. A common way of diagnosing regressivity is to compare the sales ratio for homes with different sale prices. A property’s sales ratio provides a comparison between a property’s assessed value and the same property’s sale price.
Why does regressivity matter?
When assessment are conducted accurately, the resulting property taxes are indeed proportional to a property’s actual value. However, when property assessment is inaccurate, the resulting property taxes will also be inaccurate.
Because no assessor can ever inspect every single home in a city, no assessment system will ever be perfect. There will always be information which the assessor simply doesn’t know. When assessments are conducted equitably, though, residents can at least be confident that they are all being treated the same, even if the system is flawed. For example, if the average sales ratio for all homes is the same, residents can be confident that the system is not biased with respect to price, meaning that owners of both more and less expensive property will pay their fair share of taxes on average.
The graph below shows what the average sales ratio should look like in a properly functioning assessment system, as well as what can go wrong when assessments are regressive. If assessments were perfectly accurate, every home would be valued at exactly 100% of its value, meaning that the sales ratio would be 1 for every property, as depicted by the dashed orange line. However, when the average sales ratio is higher for low-priced homes than for high-priced homes, as depicted by the solid blue line, assessments are regressive.
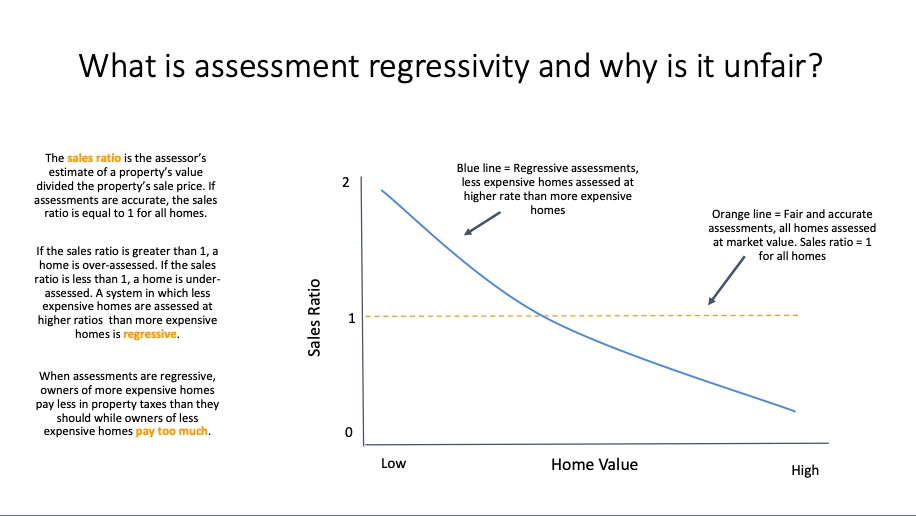
Regressive assessments lead to regressive taxation, in which owners of low-value property pay too much in taxes while owners of high-value properties pay too little. A regressive tax system can shift the collective tax burden from high-value property owners to lower-value property owners, putting a strain on the city’s most financially-vulnerable residents.
What does regressivity look like in the real world?
Suppose the average home that sold for $100,000 is actually assessed at $120,000. Meanwhile, the average home that sold for $1 million is assessed at $800,000. Suppose, by law, all properties should pay 1% of their assessed value in property taxes each year. In this scenario, the $100,000 home pays $1200 in taxes, for an effective tax rate of 1.2%. The $1 million home pays $8000 in taxes, for an effective tax rate 0.8%. The result is that the low-priced home has a 50% higher tax rate than the high-priced home (1.2/0.8 = 1.5).
Spurious Regressivity.
One limitation of sales ratio studies is that a property’s sale price may be an imperfect indication of its true market value. Given inevitable random factors in the sale of any individual property, the final price may include some “noise.” If so, this will introduce some measurement error into the analysis, which could lead to the appearance of regressivity when there is none. For instance, consider two hypothetical homes that are identical and each worth $100,000. If both homes went up for sale at the same time, one might fetch a price of $105,000, say if the seller is a particularly savvy negotiator, while the other home might garner only $95,000, say if the buyer is a particularly savvy negotiator. If the assessor appropriately assessed both homes at $100,000, a sales ratio analysis would indicate regressivity (the higher-priced home is under-assessed and the lower-priced home would be over-assessed). While there is no reliable correction for measurement error of this kind, as long as the extent of measurement error is small, relative to the price, the extent of bias will also be small.
In all of our we reports, we use Monte Carlo simulations to estimate the extent of measurement error that would need to exist for any of our tests to falsely show regressivity due to measurement error in sale prices. We also report correlations between sales ratios and Census median housing values, as well as other tract-level demographics. These tests are not subject to the same concerns about measurement error in sale prices.